BLOG
In the life sciences industry, a knowledge graph models data as entities, such as drugs, proteins, and diseases, and the relationships between them. Public knowledge graphs have put millions of relationships within reach of almost any research team. Open Targets collates target-disease evidence from 22 sources to help rank drug targets. Hetionet joins 29 databases into 2,250,197 relationships and was assembled to help prioritize existing drugs for new uses. PrimeKG links 20 resources into 4,050,249 relationships across ten biological scales.
But access to a graph is only the start. When it comes to connecting a drug's targets to a disease outcome, the process can still require assembling evidence from several sources, working through thousands of relationships without scripting every step, and judging how far each connection can be trusted. Some connections rest on a direct experiment, others on automated extraction from the literature, and a path that looks convincing on screen can end up meaning nothing biologically.
In this blog post, we'll present a use case that shows how a curated knowledge graph makes that work easier and quicker, with more confidence in the result. Using one investigational drug, ONC206, we'll show how a researcher can narrow a large set of relationships with a few filters and inspect the evidence behind what remains.
The walk-through runs in DISQOVER, ONTOFORCE's AI-ready semantic data platform for life sciences, which harmonizes public, licensed, and internal data in one curated knowledge graph. Public resources such as Open Targets are part of that graph, alongside licensed content such as QIAGEN's DKB. That gives a researcher one place to search, filter, and check the evidence, so the narrowing described above happens without moving between systems.
This walk-through pairs curated public data in DISQOVER with QIAGEN's Discovery Knowledge Base (DKB), which combines 600M+ AI-derived and 24M expertly curated relationships. ONTOFORCE and QIAGEN Digital Insights have partnered to help life sciences organizations connect curated biomedical evidence with proprietary research data to support discovery and AI workflows. The partnership brings DKB into the DISQOVER platform to provide a more connected way to search, harmonize and interpret biomedical data across public, licensed and proprietary sources.
Knowing which proteins a drug binds is only the first step. Researchers trace the path from target engagement to physiological outcome: which molecules those targets interact with, and which of those are linked to the disease. That path turns a list of targets into a hypothesis worth testing, and gives teams evidence they can defend when others review the work. Teams follow it for several reasons:
This work is getting more attention. As data increasingly supports later steps, such as identifying molecules and leads, the harder problem in drug discovery moves upstream: understanding mechanisms and finding targets that hold up in model systems and in human biology.
Our walk-through takes the competitive intelligence angle, with ONC206 as the example. A novel drug gaining traction raises an obvious question for other teams: does it affect cancer growth in a new way, or through a familiar mechanism they have already tried? If it is new, they may already have a molecule tested against one of the same targets.
Here we're looking at an investigational drug in phase 1 clinical trials for patients with nervous system cancers, including brain cancer. Public data lists two known targets: a dopamine receptor and a mitochondrial protease, an enzyme that cleaves proteins inside the mitochondria. These are two different kinds of protein, and how acting on them affects cancer growth is the open question we're taking on.
Our operating question: how do ONC206's two targets connect to glioma, through the molecules they interact with?
Answering it means combining evidence from several places:
When this evidence is scattered or can't be grounded, teams can end up with false leads, wasted research and lab time, and skepticism from review boards. Each of those costs traces back to one need: reaching the few relationships that matter quickly, with the evidence behind each one in view.
Public data gives the clinical and bibliographic picture. With the curated public data available in DISQOVER, ONC206 appears with its phase 1 trials, available publications, and synonyms from different sources, along with the two known targets named above. One search returns all of it, so there is no need to check each database separately. This all shows what the drug touches. How those targets connect to cancer growth is still the open question.
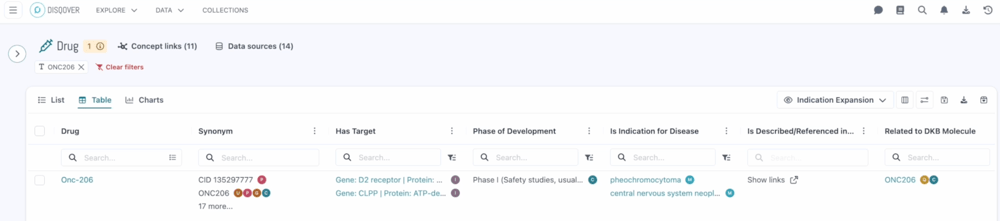
ONC206 in DISQOVER: synonyms, targets, phase of development, and indications from 14 data sources in one row.
Opening the synonyms shows why one search is enough. ONC206 is recorded under 19 names and identifiers, from trial codes such as ONC-206 and ONC 206 to full chemical names and database IDs such as CHEMBL4650311 and CID 135297777. DISQOVER resolves them to one drug, so a search for any of them finds the same record, and each name is tagged with the sources that use it.
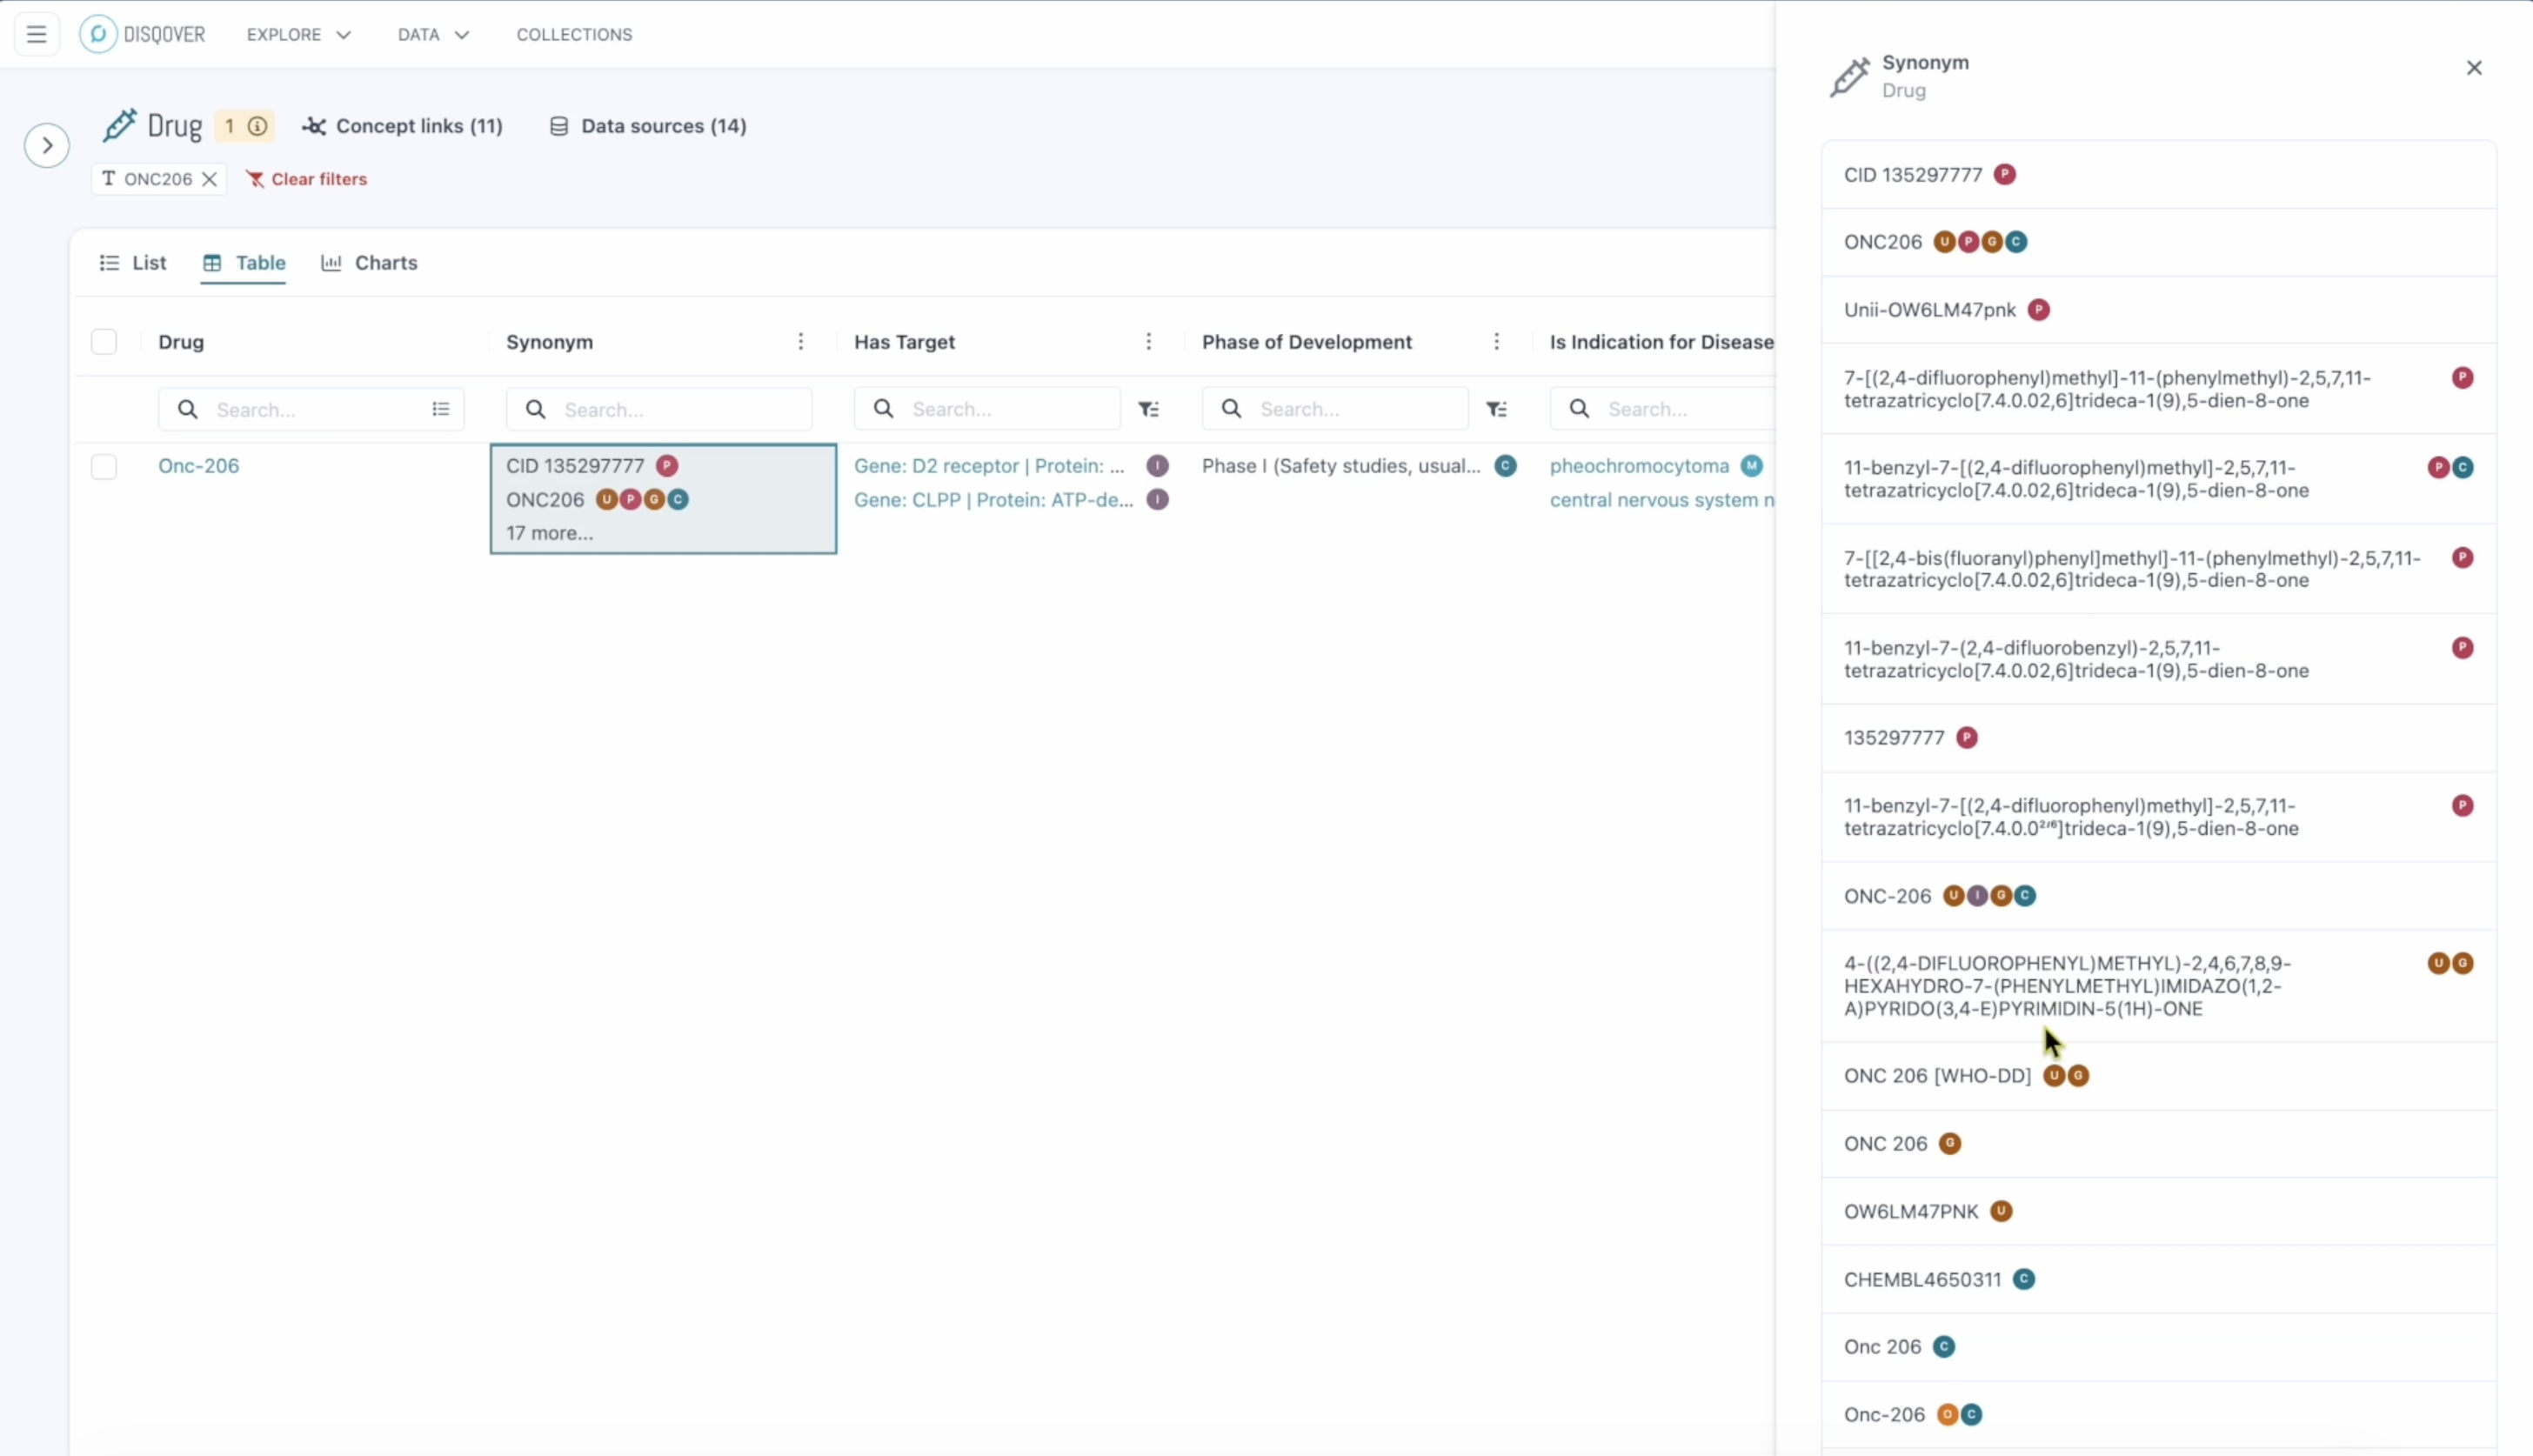
The synonym panel: every name for ONC206, tagged by source and resolved to a single drug.
Starting from the drug in the DKB adds details that public sources often lack in structured form: the drug's function, therapeutic category, and chemical classification, including its chemical parents. The drug's function is recorded as both agonist and antagonist, and the record shows how it acts on each target: it activates the protease and inhibits the receptor.
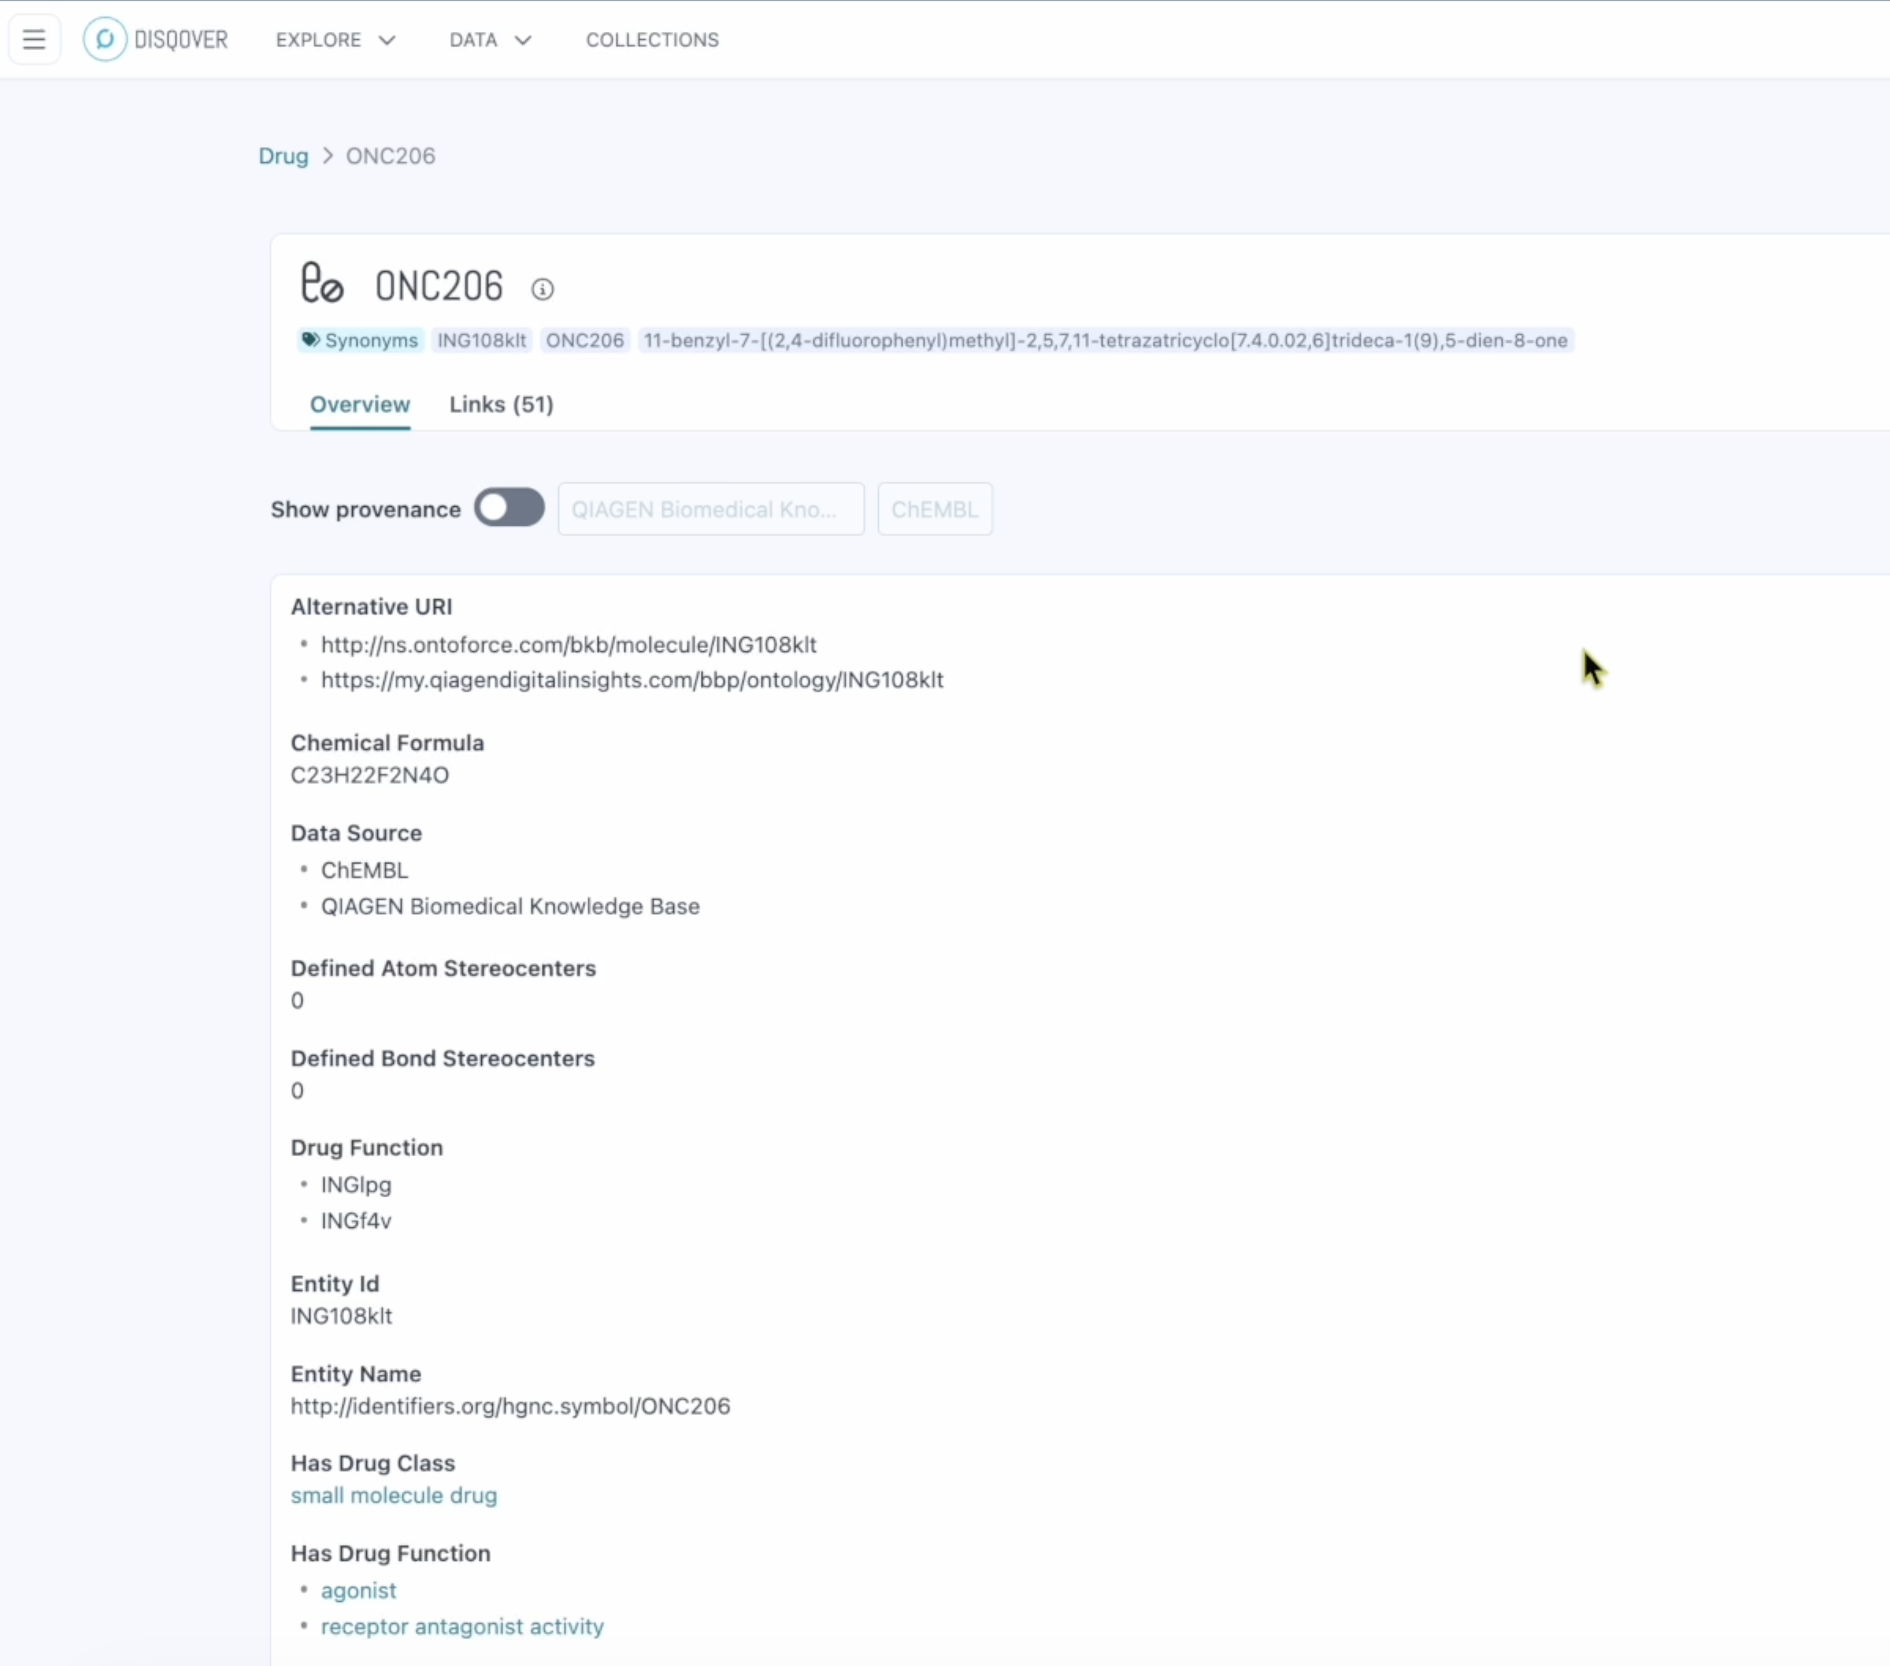
ONC206 as recorded in the DKB: small molecule drug, with agonist and receptor antagonist activity, drawn from QIAGEN's knowledge base.
Each relationship rests on one or more findings. A finding records its source, a plain-language sentence describing the result, a confidence level, and the experiment type. In this example, most findings are labeled experimentally observed. The finding that ONC206 is an agonist of the human ClpP protein, for instance, cites the NCI Thesaurus as its source and links to the drug-disease relationships it supports.
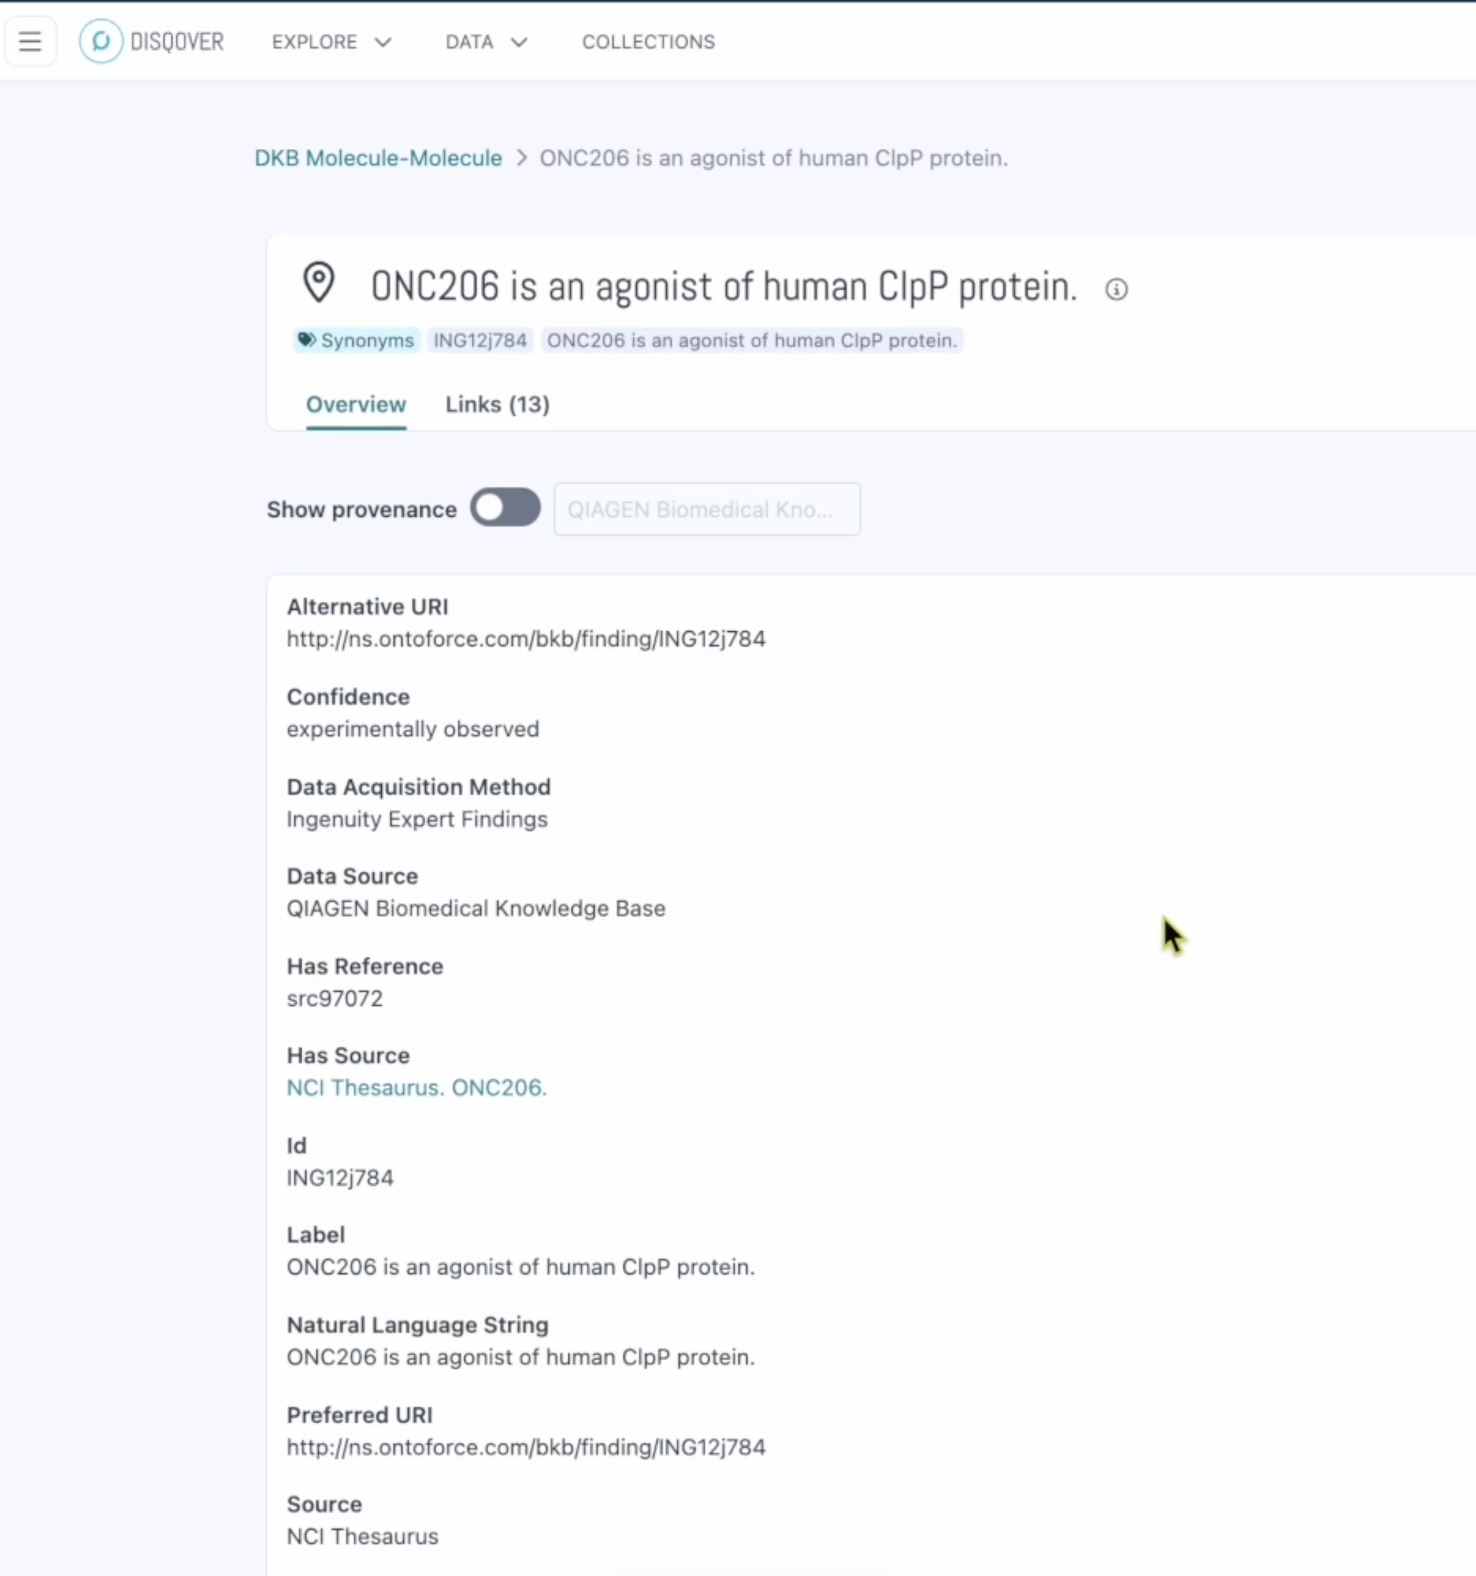
One finding, fully traceable: the plain-language statement, its confidence, its source, and the drug-disease relationships it supports.
Start broad, then filter on the evidence. The drug and its two targets have about 1,000 relationships with other molecules, mostly proteins. Switching to high-level nodes expands that to about 2,700. Filters on directness, disease, and relationship type then bring it down to nine. In DISQOVER, none of these steps requires writing a query. Rather, a user can easily toggle the filters on and off.
A high-level node groups the representations of a gene. The same gene can be studied as DNA, as RNA, as a protein, and in other organisms, and that information is often scattered across a graph. High-level nodes bring it together, so switching to a gene-level view takes one step instead of mapping each form by hand.
|
Stage |
What changes |
Relationships |
|
Drug and its two targets |
Relationships with other molecules, mostly proteins |
About 1,000 |
|
High-level nodes |
Gene-level view across DNA, RNA, protein, and other organisms |
About 2,700 |
|
Linked to glioma |
Direct relationships only, where a partner is related to glioma (a type of brain tumor) |
31 |
|
Causal relationships |
Relationship type category is causal |
9 |
Charts in DISQOVER help interpret the set along the way. The relationships are enriched in brain and central nervous system tissues, and many occur in the mitochondria, which fits a mitochondrial protease target. Recurrent cancer is the most common function among the molecules involved, and apoptosis and cell death also appear, both consistent with an anti-cancer drug. In the network view of the 31 relationships, two proteins connect both of the drug's targets.
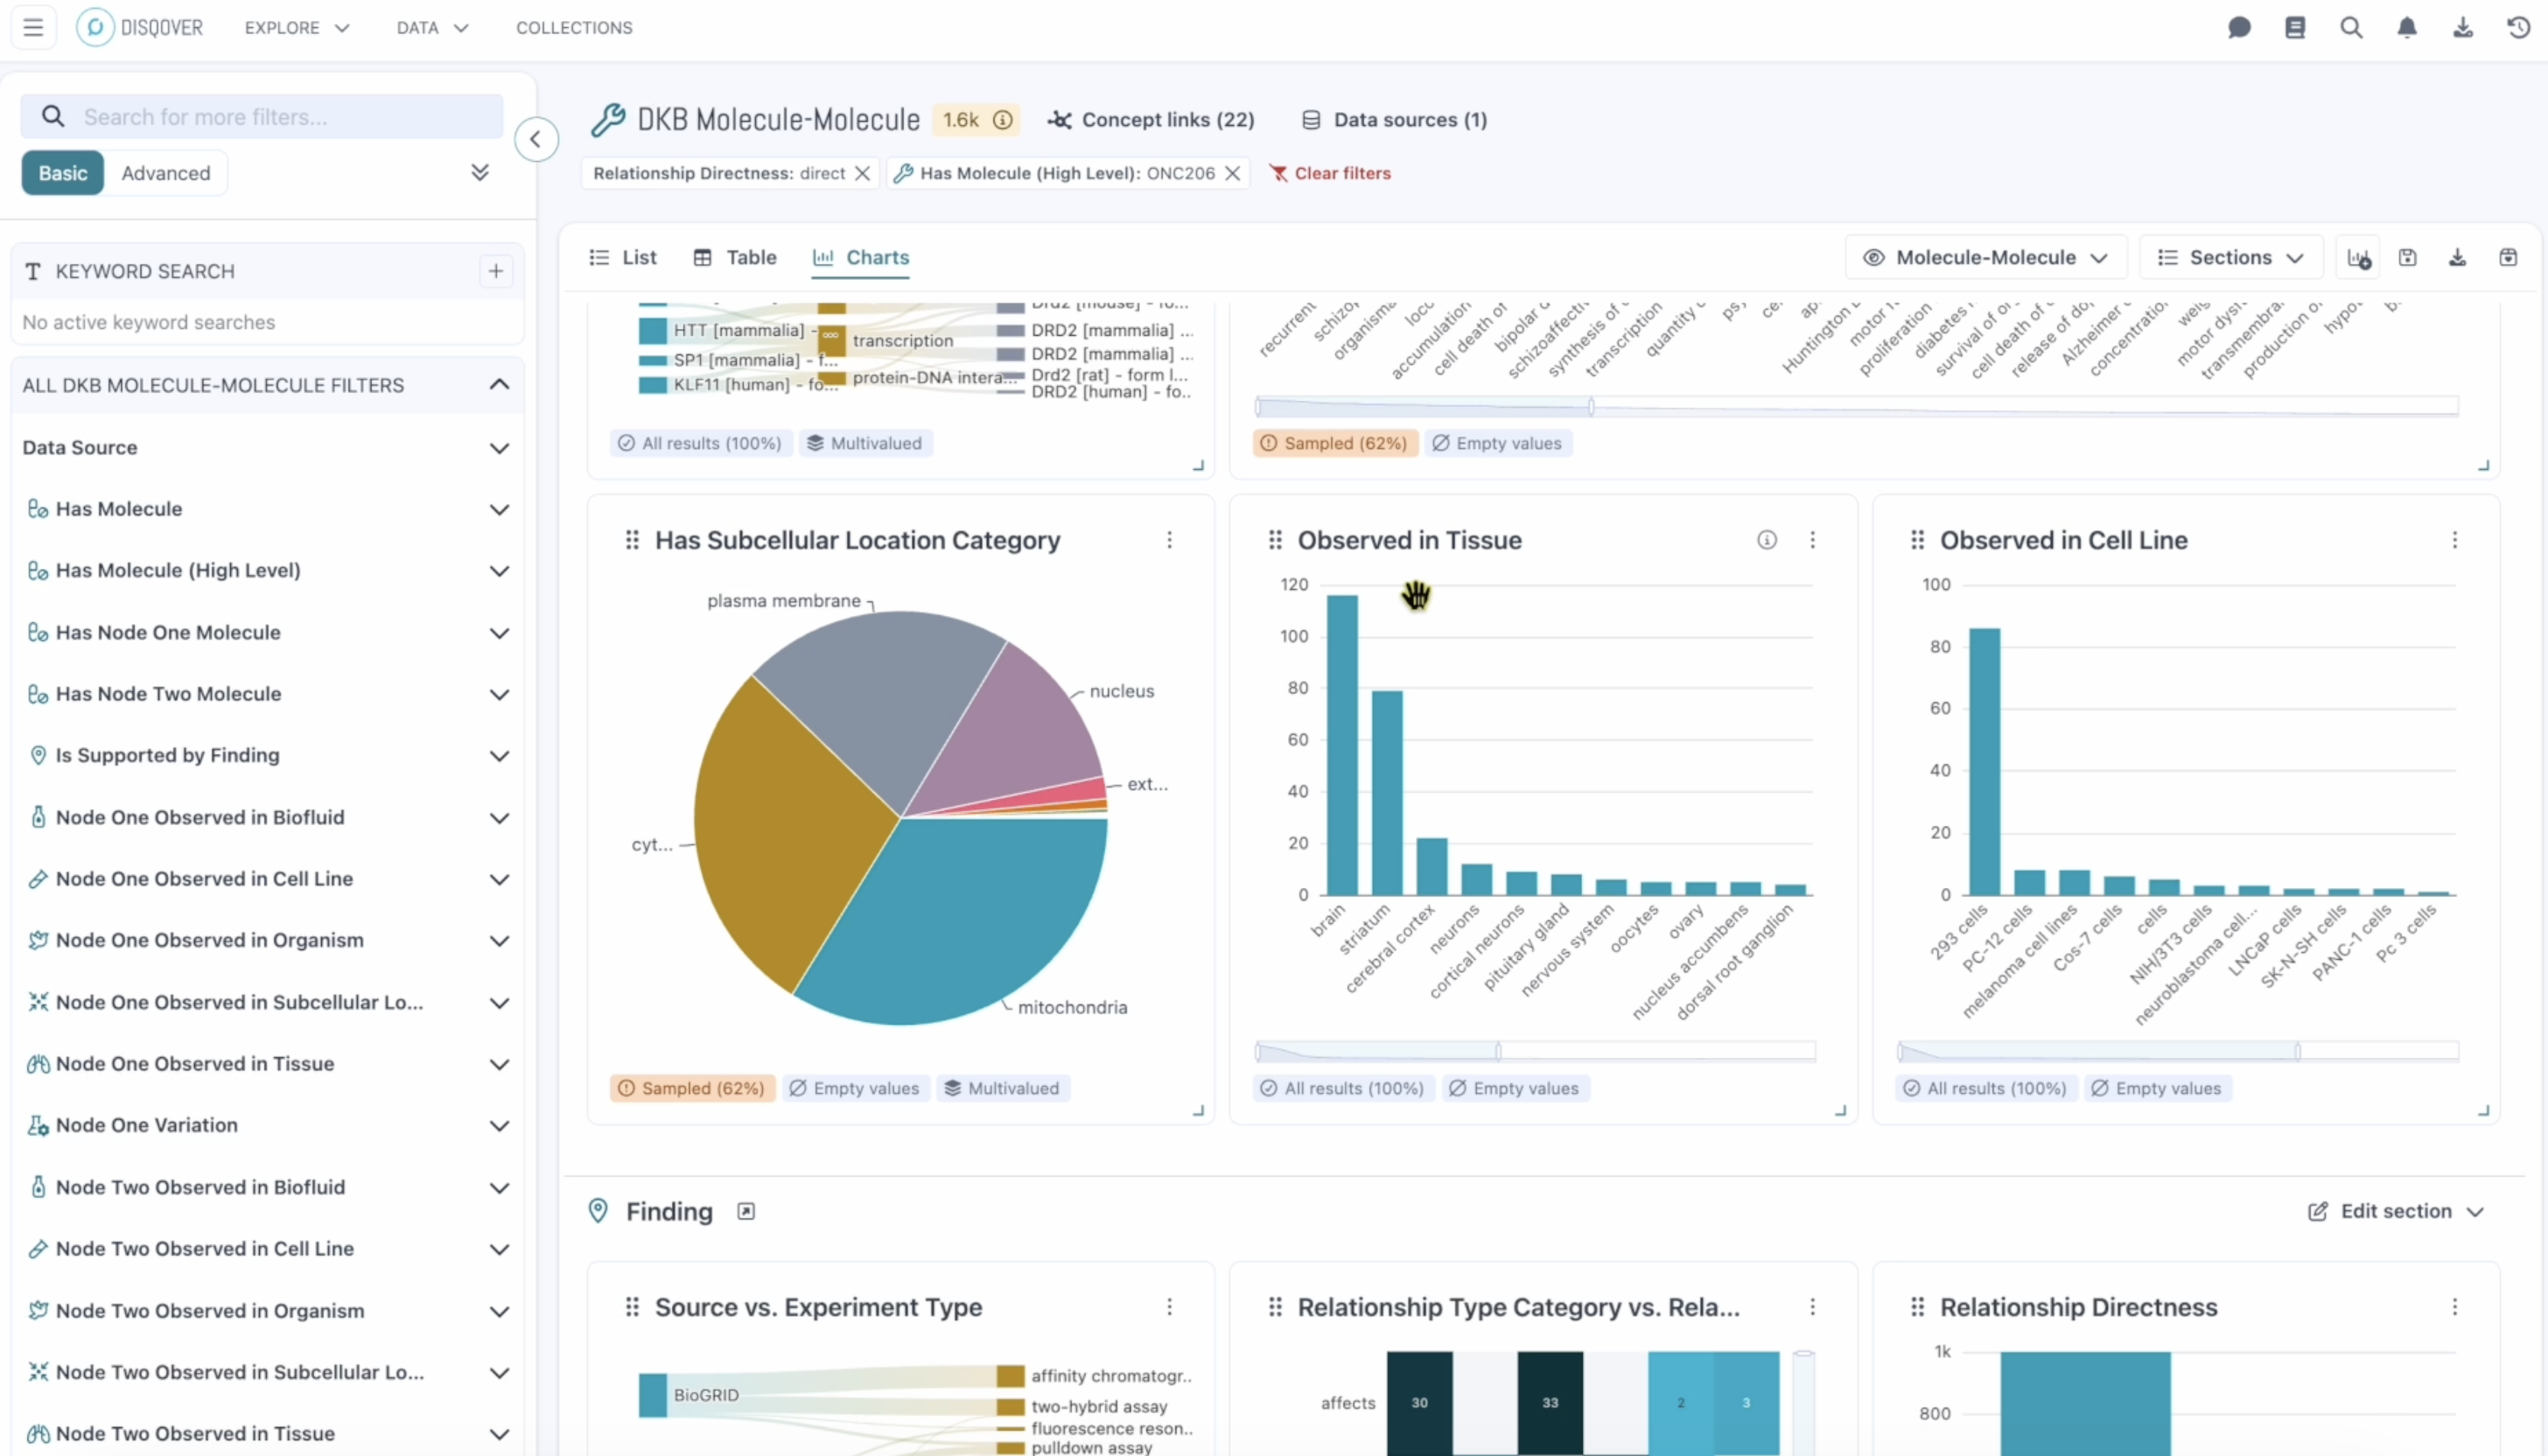
Charts update as filters are applied: mitochondria leads the subcellular locations, and brain and striatum lead the tissues.
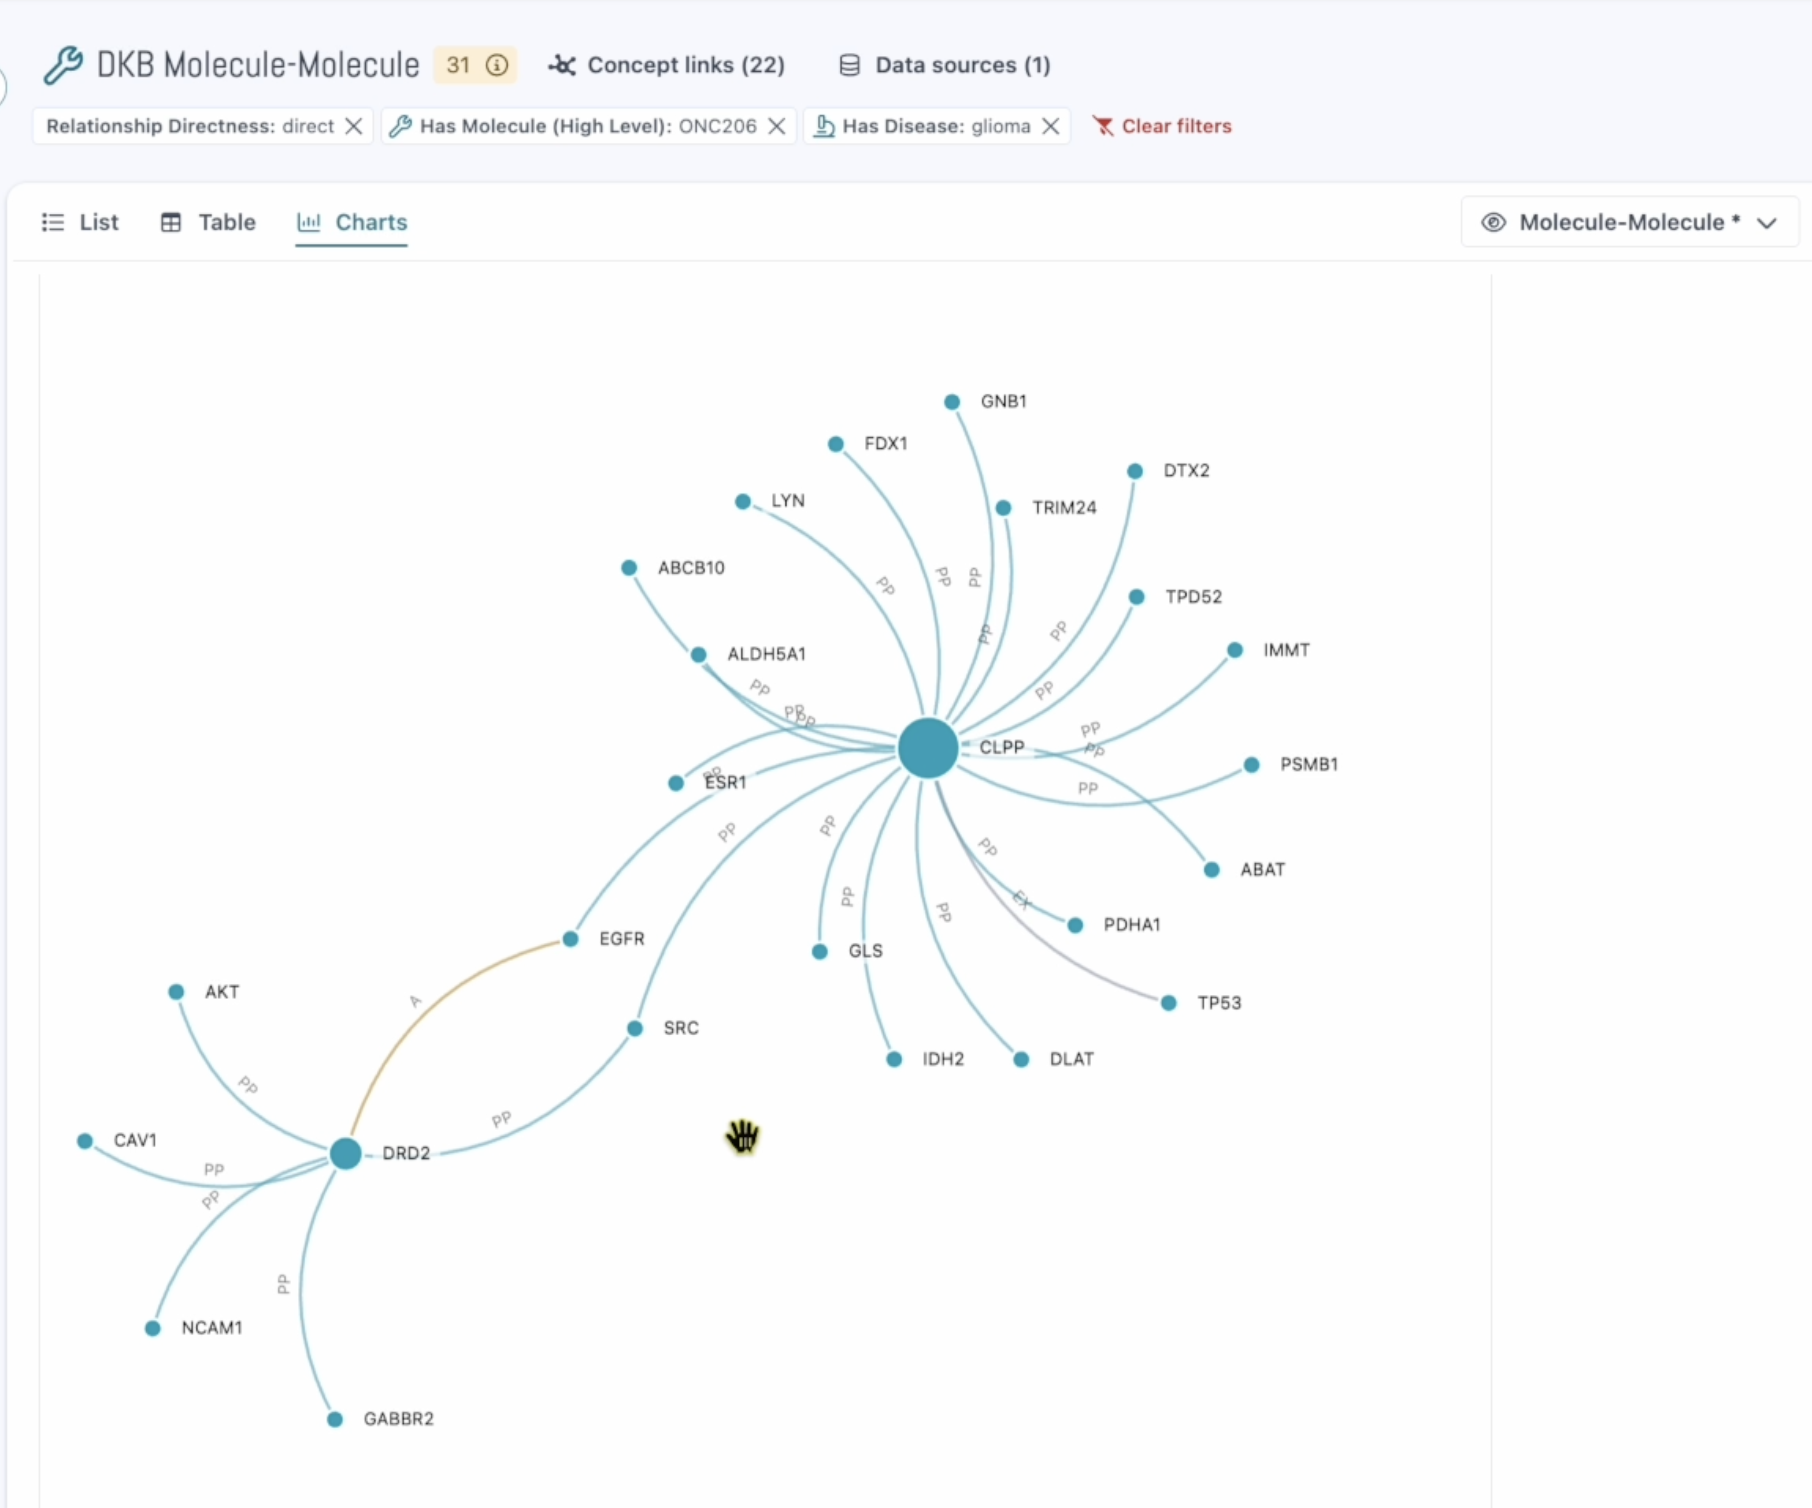
The 31 relationships linked to glioma as a network: CLPP and DRD2 at the centers, with EGFR and SRC connecting the two.
The nine remaining interactions are ones where a partner is known to cause glioma. From there, a researcher can follow links to the supporting clinical studies and publications, or to the experimental data behind each finding.
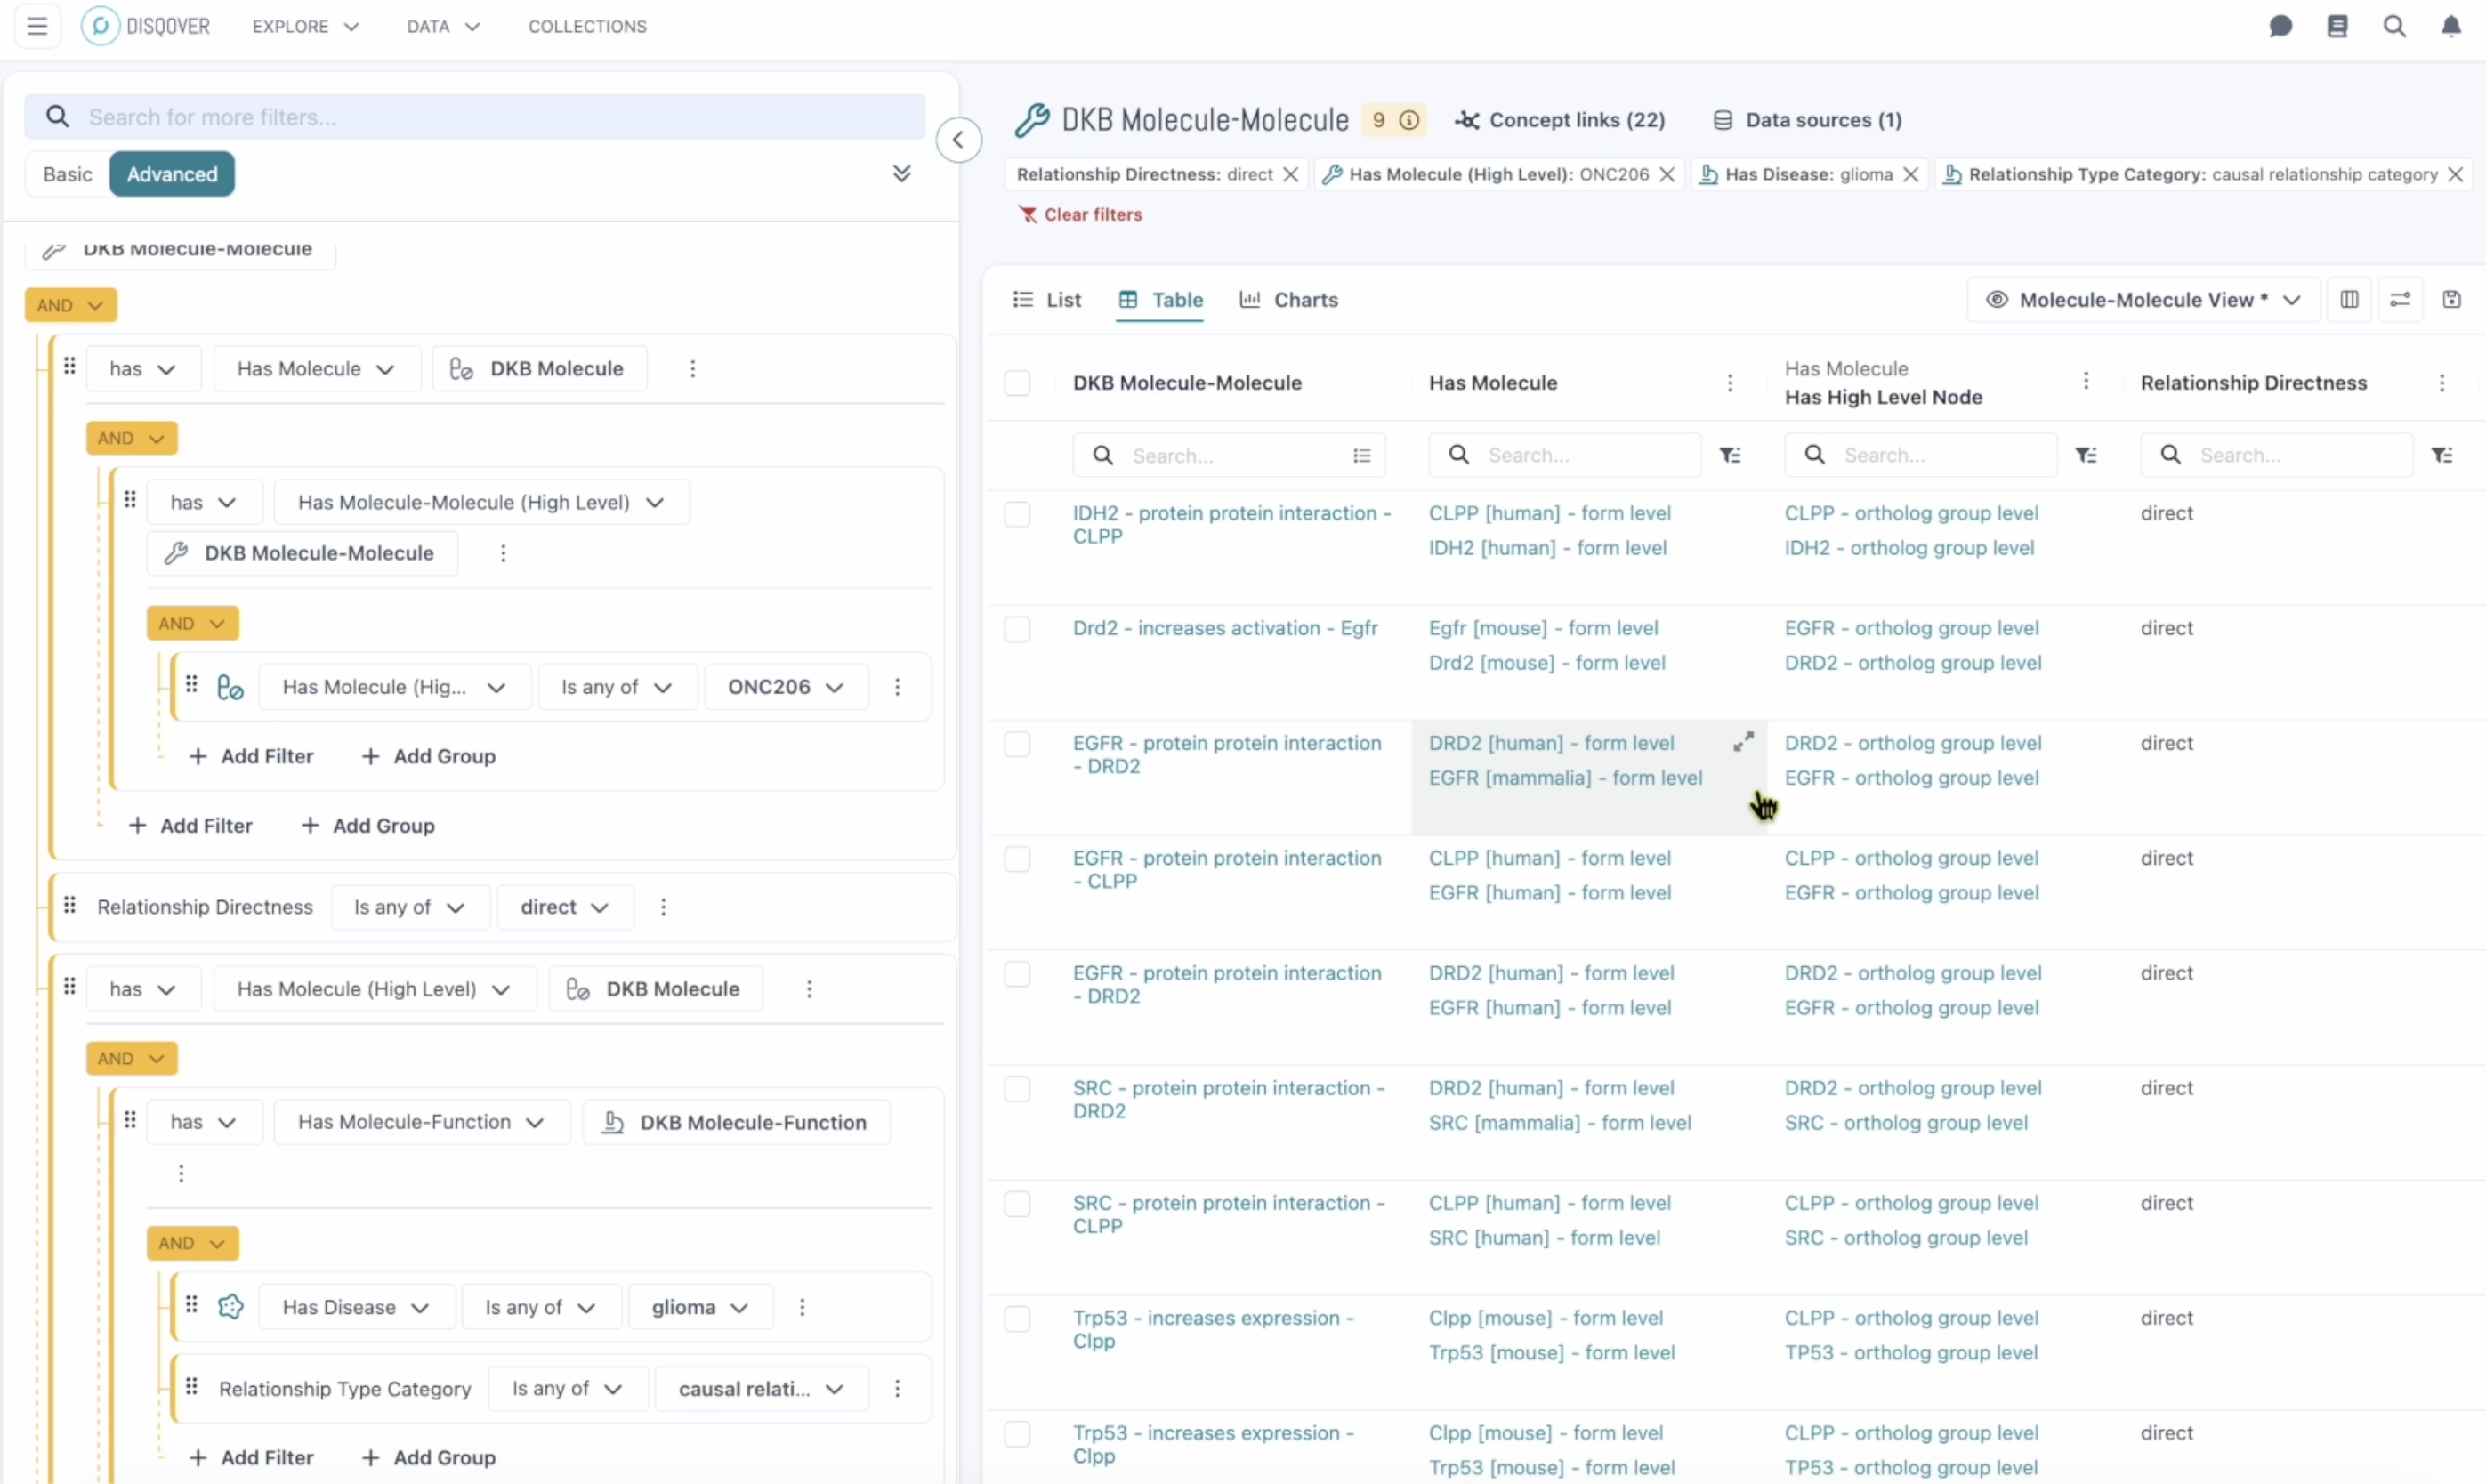
The nine remaining relationships. The filter panel on the left shows the whole query, built by point and click: ONC206, direct relationships, glioma, and the causal relationship category.
What do these nine interactions tell you?
The nine interactions are candidates for follow-up, not a validated mechanism. A graph can show that a connection is documented and where the evidence came from. It cannot show that the connection explains how the drug works in a patient, and confirming that takes experiments.
Getting to good candidates sooner is where a curated knowledge graph saves the most time. This kind of tracing sits early in drug discovery, before a team commits lab resources to a target or hypothesis, and the slow part is often not the analysis but the preparation: collecting data from separate sources, mapping identifiers, and cleaning it before a single question can be asked. When that work is already done in a harmonized graph such as DISQOVER, a researcher starts from the question instead. In ONTOFORCE's experience, that can cut the effort to reach an answer from months to weeks, and sometimes from weeks to hours. Better-grounded candidates also mean fewer false leads reach the lab, which protects the more expensive work that follows.
Yes. DISQOVER can be queried by AI agents through the Model Context Protocol (MCP), a standard way for AI models and agents to connect to external tools and data sources. A researcher can ask the same question in plain language: what are the targets of ONC206, how does the drug affect them, which molecules do those targets interact with, and which of those partners cause glioma.
The agent works through those steps in a few minutes, querying the same curated knowledge graph a researcher uses in the interface. As in the interface, it helps to tell the agent to use high-level nodes, so it looks across a gene's different forms and orthologs rather than a single representation.
Every answer links back to DISQOVER, where the researcher can open each relationship and verify the evidence. Because the agent and the researcher work from the same graph, the agent speeds up the question without becoming a separate, unverifiable source of answers. You can watch a recorded walk-through of the agent run, alongside the full use case, using the link at the end of this post.
The process extends beyond one drug: begin with public context, add curated evidence, narrow with filters on relationship properties, and keep a link to the source at each step. In DISQOVER, which brings these sources together in one curated knowledge graph, each step is a search, a filter, or a click rather than a separate project, and every result is labeled with provenance. When a researcher and an AI agent query the same graph, they work from the same evidence, which makes the answer easier to check.
ONTOFORCE and QIAGEN recently hosted a joint webinar to illustrate how DISQOVER connects to QIAGEN's Discovery Knowledge Base to give research teams a shared, queryable layer for both technical and non-technical use.
How does a knowledge graph help investigate mechanism of action?
It stores molecules, diseases, and pathways as connected entities. A researcher can start from a drug, follow relationships to targets and interaction partners, and filter by direction, effect, confidence, and relationship type. When relationships carry their source, each step can be checked against the underlying evidence.
What is the Discovery Knowledge Base?
QIAGEN's Discovery Knowledge Base is a knowledge graph of molecular relationships built over about 20 years. It combines 600M+ AI-derived relationships with 24M expertly curated ones. Relationships record details such as the direction and type of causality, the biological or experimental context (species, tissue, disease state), and links to public identifiers and synonyms for each entity involved.
What is MCP, and how does it relate to a knowledge graph?
MCP (Model Context Protocol) is a standard way for AI models and agents to connect to external tools and data sources. Through an MCP endpoint, an agent can query a knowledge graph such as DISQOVER directly, and its answers can link back to the source environment for verification.
What are the limits of knowledge graphs in drug discovery?
No graph is complete, and connections vary in reliability depending on whether they come from direct experiments or automated extraction from the literature. Well-studied genes also tend to collect more connections than understudied ones. Results from a graph are leads that need confirmation in the lab.
How is querying a knowledge graph different from using a graph neural network?
A graph neural network learns patterns across a graph and predicts links that are not yet recorded, such as a plausible gene-disease connection. Querying works with relationships that already exist: the researcher starts from an entity, follows documented connections, and narrows them with explicit filters. Predictions need the same checks on the underlying evidence as any other lead.
ONTOFORCE enables life science companies to unlock hidden insights from data.
With DISQOVER, built on knowledge graph technology, we support life sciences and pharmaceutical companies with innovative data management and visualization.