
BLOG
At ONTOFORCE, we’re committed to evolving our flagship product, DISQOVER, so it keeps pace with the challenges and opportunities of life sciences data. Our recent releases, 7.11, 7.12, and 7.13, deliver a mix of foundational improvements, AI-powered assistance, and intuitive user experiences that empower users across functions. From a smarter drug data model to natural language querying and richer visualizations, we’re covering what’s new in DISQOVER below.
Reliable insights start with clean, transparent data. Based on direct user feedback, we’ve introduced a new drug data model that eliminates duplication, separates drug and IDMP concepts, and integrates GSRS as a trusted source. The results are clearer concept definitions, fewer mapping issues, and easier implementation across use cases.
In the Data Ingestion Engine, we’ve simplified configuration with Unified Attributes, merging properties and facets into one streamlined entity. Each attribute is now more consistent, easier to configure, and automatically validated, which makes data ingestion faster, cleaner, and more powerful.
.png?width=550&height=440&name=DISQOVER%20LABS%20ONTOFORCE%20(2).png)
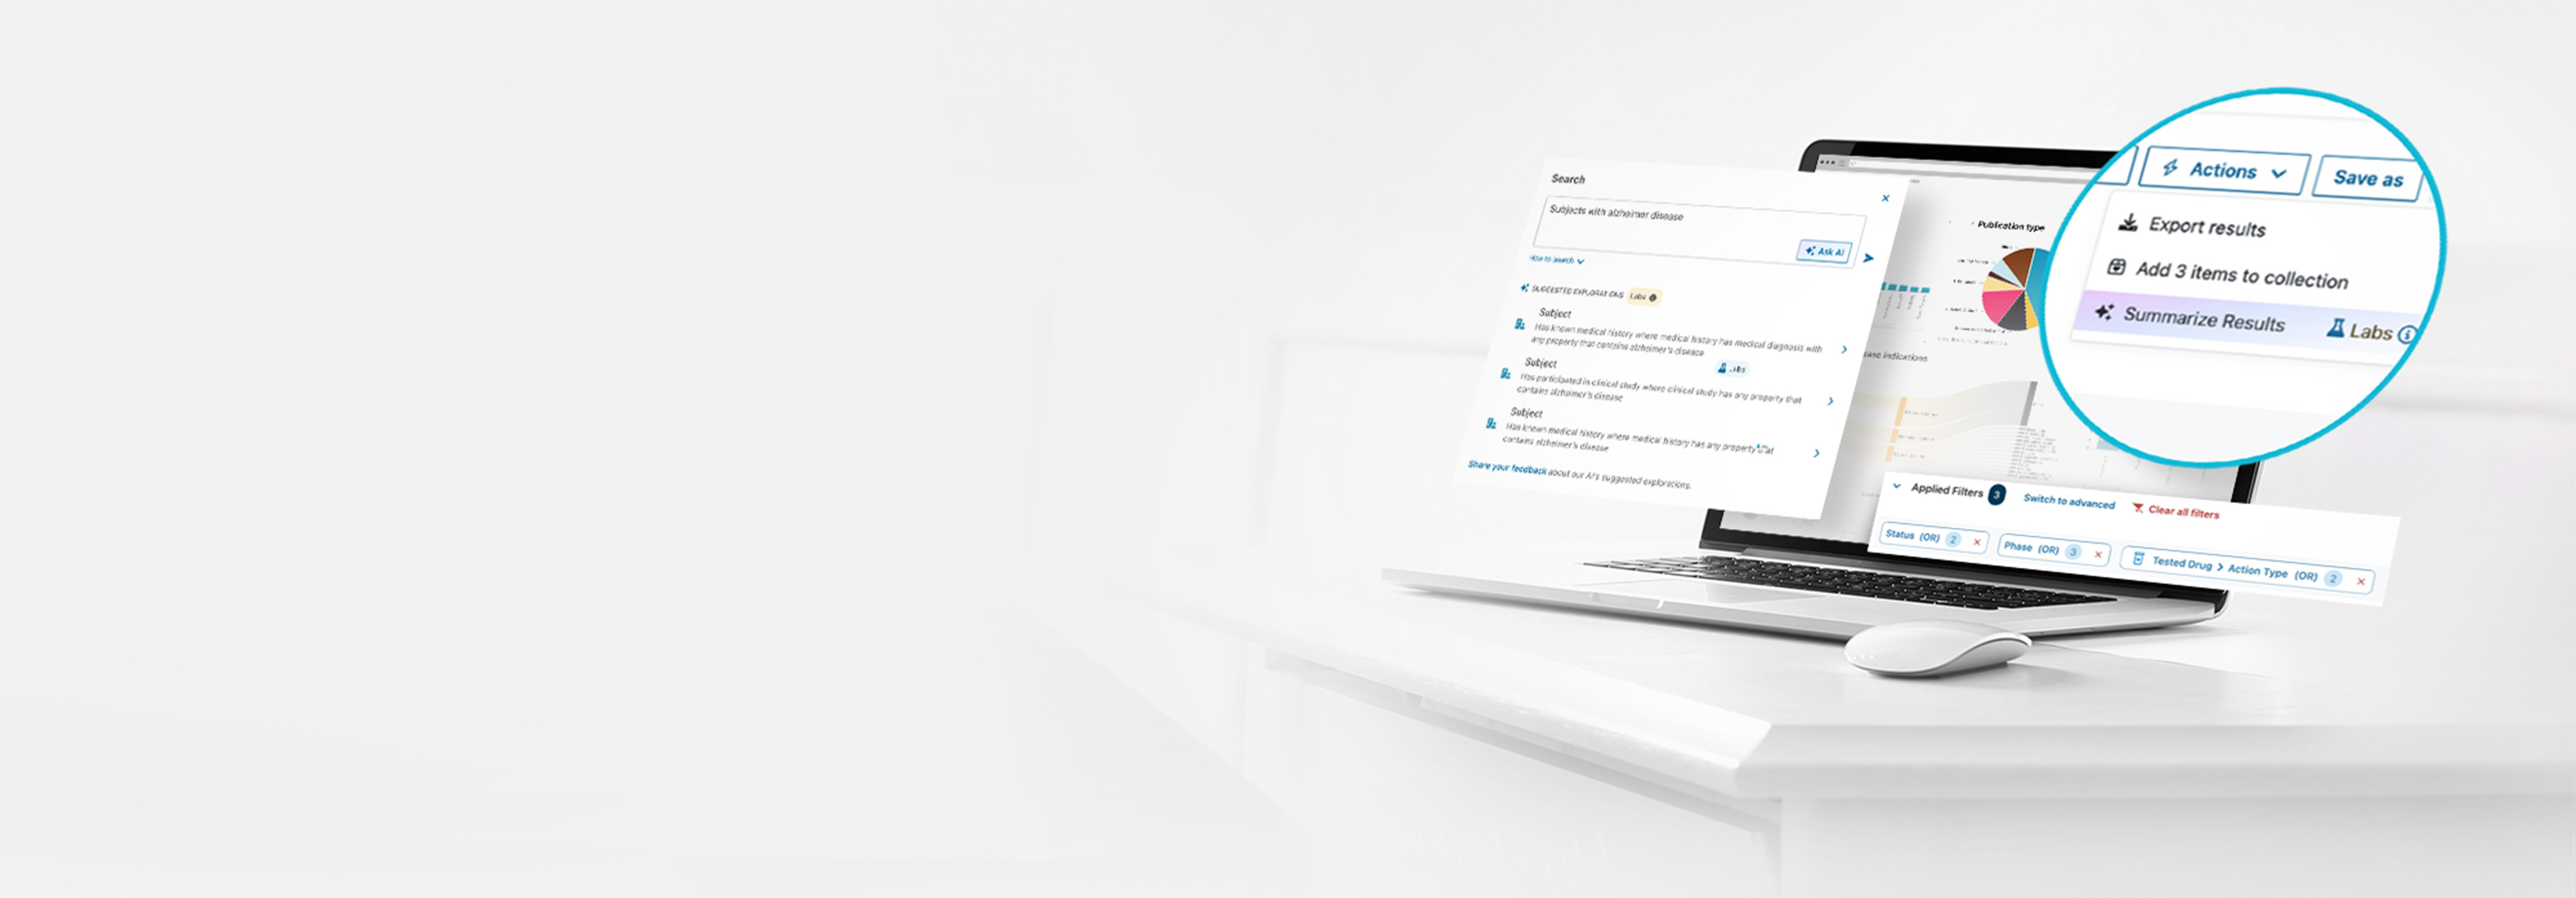
In July, ONTOFORCE introduced DISQOVER Labs, our new opt-in/out functionality designed to give users early access to new and evolving features within the DISQOVER platform. Labs features are marked with a “Labs” tag, making them easy to identify, try, and provide direct feedback on. You can learn more about how DISQOVER Labs works here.
Two exciting Labs features are AI-powered tools that make data exploration more intuitive and efficient:

Quick Filters is another new DISQOVER Labs feature that was introduced in July. Quick Filters transforms how users interact with their data. As users explore a concept, filter widgets appear in the sidebar, providing easy access to filtering options while also visualizing the distribution of values in their results. In essence, Quick Filters are perfect for speedy querying across linked data.
Since Quick Filters was released, there have been major improvements to the feature across the monthly releases:
Great insights come from intuitive visuals—and from a platform that makes them easy to use. With releases in the past quarter, DISQOVER has introduced new chart types and usability upgrades that make exploring and managing data more efficient than ever.
Boxplots
Quickly detect distributions, outliers, and variation with our new boxplot visualization. This powerful chart helps you spot patterns at a glance and dive deeper into data stories with just a few clicks.
Scatter plots
Uncover correlations and trends across large datasets with scatter plots. Plot values on the X and Y axes, then add a categorical property to color the points. Suddenly clusters, patterns, and outliers become crystal clear—turning raw numbers into actionable insights.
Gantt charts
Bring time-based data to life with intuitive Gantt charts. Visualize start and end dates, color-code blocks by category, and organize them into swim lanes for better clarity. Perfect for tracking progress, aligning activities, and communicating timelines.
Flexible chart views
Create multiple chart views instead of being tied to just one. Organize them around projects, teams, or use cases, set dashboards as defaults for yourself or your organization, and choose between private or shared dashboards for seamless collaboration.
Configurable row heights
Switch between Normal and Compact row heights in the results table. Compact mode reduces row height to display a single value per cell, giving you a tighter, more data-dense view when you need it.
Integrated wiki
Stay productive with in-platform documentation. The new integrated wiki opens directly inside DISQOVER and automatically points you to the most relevant page for your current task—delivering context-aware help right when you need it.
With these latest releases, ONTOFORCE is improving how complex life sciences data is harmonized and connected in DISQOVER, while also enhancing the ways this data can be explored, visualized, and acted upon. From stronger data foundations to AI-powered assistance and intuitive visualizations, each enhancement is designed to accelerate workflows and surface insights that would otherwise remain hidden.
Looking ahead, we’re continuing to expand how users interact with their data, with several exciting features on the horizon. Among them are a new histogram chart for visualizing distributions across numerical or date values, and enhanced metrics that provide both instance counts and aggregated numbers or dates. Our commitment to continuously advancing DISQOVER ensures the platform evolves to help life sciences organizations work smarter and move faster.
If you’d like to see these new updates, you can request a demo here.
If you are attending BioTechX Europe in early October, feel free to stop by ONTOFORCE’s booth #512 for an in-person demo of these new features and more.
ONTOFORCE enables life science companies to unlock hidden insights from data.
With DISQOVER, built on knowledge graph technology, we support life sciences and pharmaceutical companies with innovative data management and visualization.
![]()
![]()
