Solve complex use cases over many heterogeneous data sources with our simple, intuitive, and customizable dashboards. Filter results in real-time and visualize the data using responsive and interconnected charts.
All essential information in a single, intuitive overview
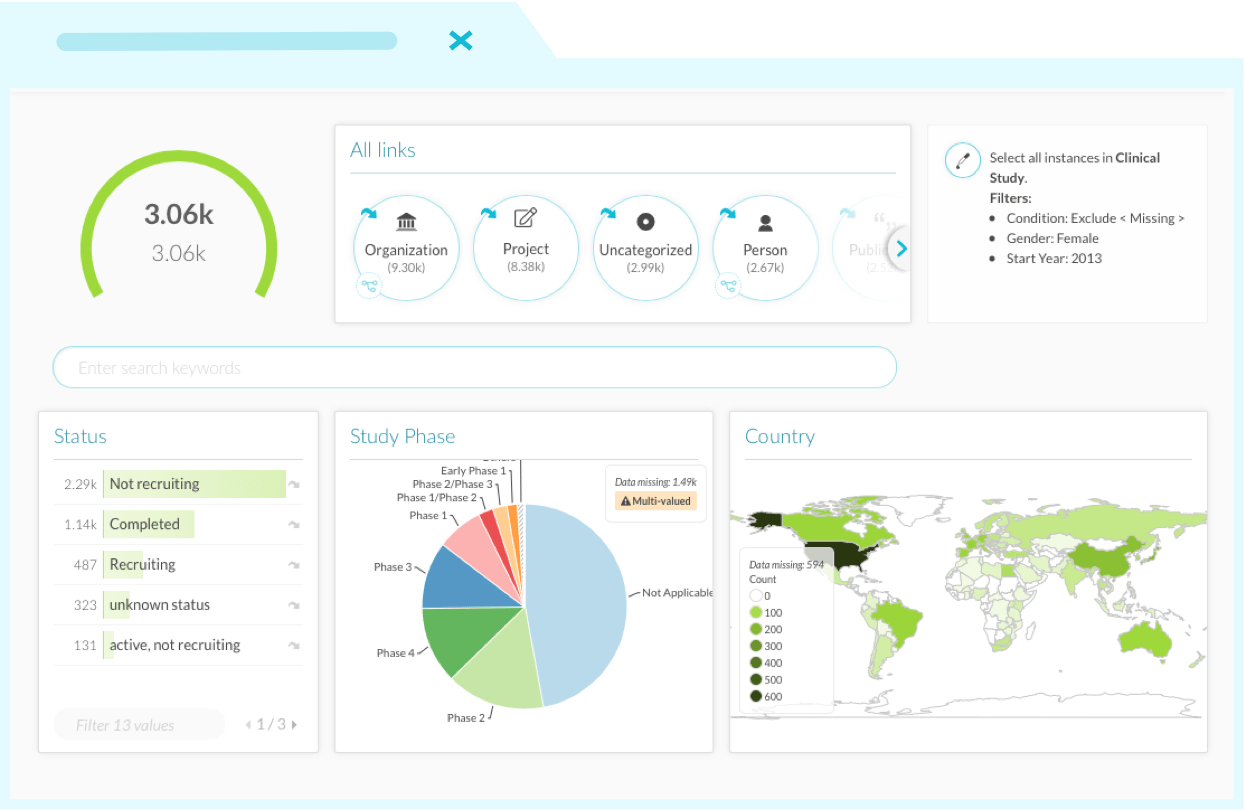
DISQOVER summarizes your search results in dashboards. This is a visual way of showing results and properties, enabling insights at a glance or further refinement of your search via filters. By seeing all relevant information in a single overview, you can quickly navigate even the most complicated use cases.
Advanced visual analytics
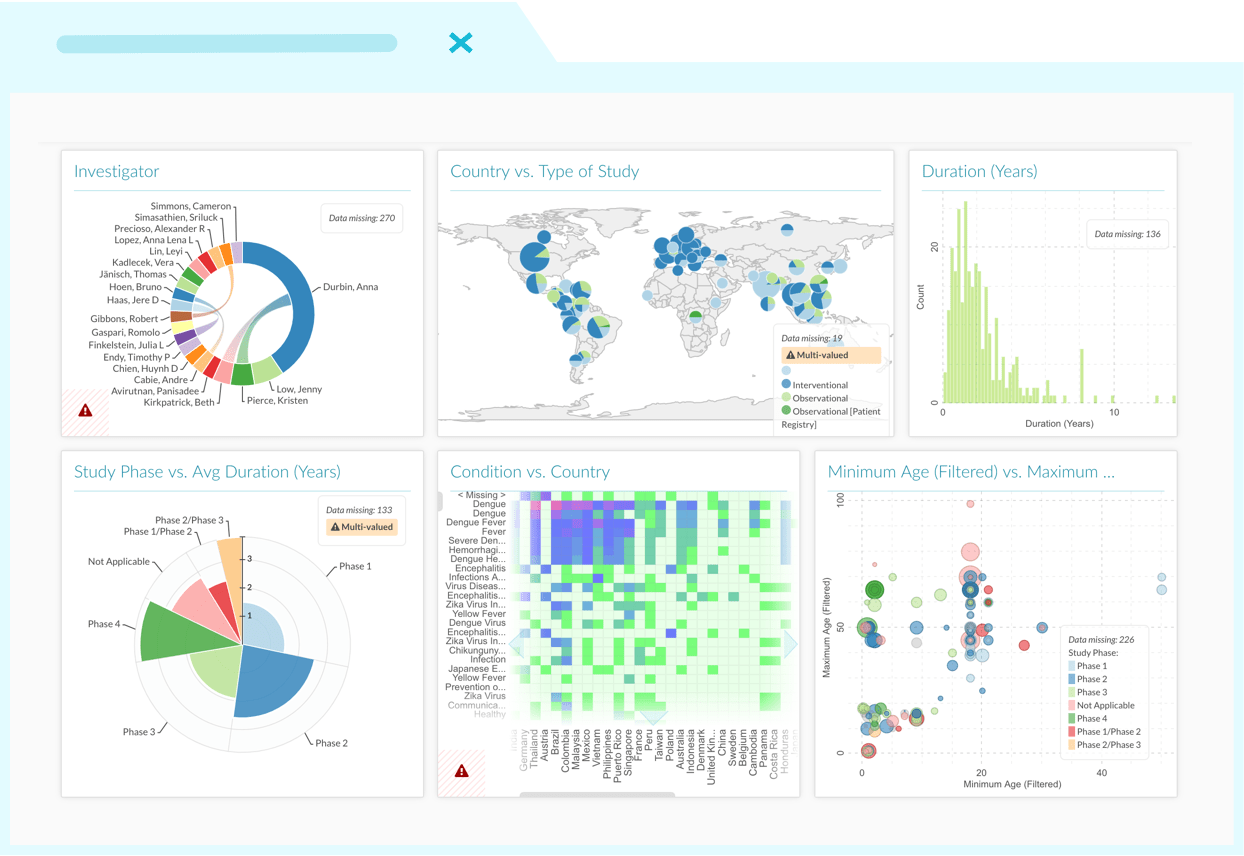
Responsive, dynamic, and interconnected charts allow you to visualize the properties of your results and answer what-if questions in near real-time.
Easily build your dashboards
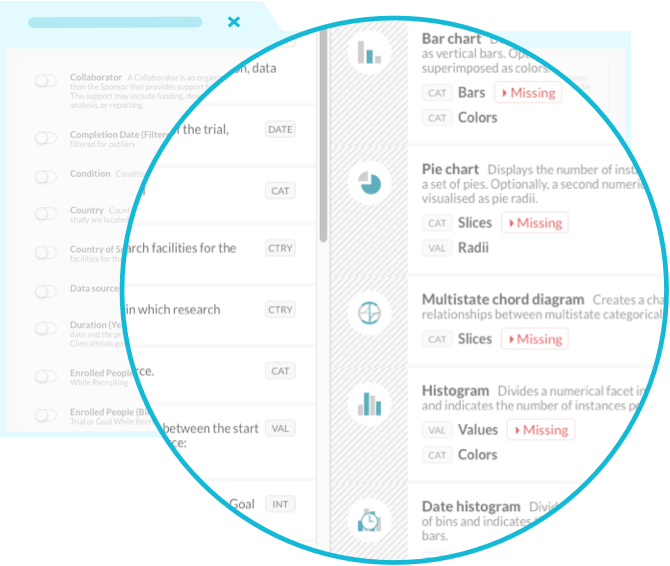
Further adapt DISQOVER to your needs and create your dashboards with interactive and customizable one- and multi-dimensional charts, such as bar and pie charts, maps, and counters.
As a data scientist, you can ensure other users see the default dashboards that are most relevant to their use cases.