

BLOG
Over the last three DISQOVER releases, we’ve focused on one clear goal: making it easier for teams to move from complex data to confident decision. With major improvements across search, exploration, visualization, transparency, and data operationalization, DISQOVER continues to evolve into a more intuitive and powerful knowledge discovery platform.
Here’s a look at what’s new in DISQOVER 7.14, 7.15, and 7.16, and how these updates help teams find data faster, understand more, and act with confidence.
A new global search experience is available directly from the home page. Users can immediately search across the knowledge graph, with DISQOVER intelligently guiding them toward the right data.
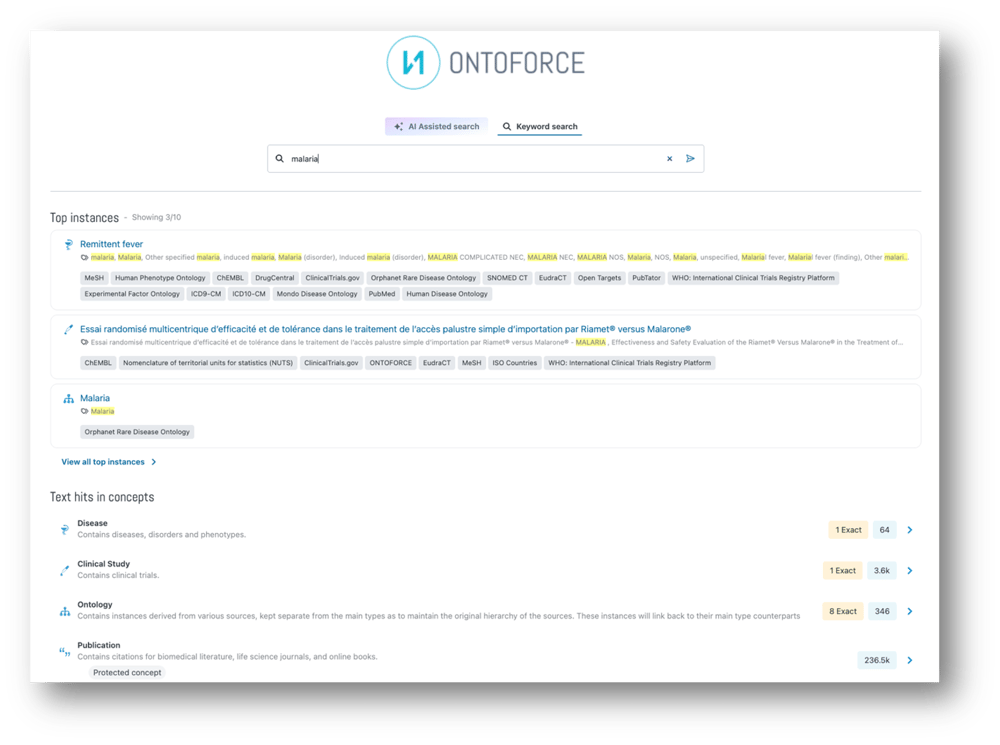
As users type in the search bar, the platform surfaces relevant concept suggestions, highlights the most relevant instance matches, and uncovers text matches across all concepts. Whether you’re looking for a specific record or exploring a topic more broadly. This same search experience is also accessible from anywhere in the platform through the top navigation.
Home pages have also become more visual and expressive. Teams can now add banner images to create context, reinforce brand identity, or signal a particular data focus. In addition, key concepts can be displayed directly on the home page as an interactive knowledge graph, offering an immediate, intuitive overview of how important entities relate to one another. Instead of starting from a list, users can explore connections visually and jump straight into the concepts that matter most.
All together, these enhancements turn home pages into engaging entry points that kick off users with momentum into their data explorations.
Charts in DISQOVER have become more interactive, contextual, and effortless to use. Users can now explore deeper without breaking their analytical rhythm.
New and improved capabilities include:
Chart creation itself is now fully interactive: As properties or axes are adjusted, charts update instantly, making it easy to experiment with different perspectives and quickly converge on the most meaningful view. Automatic chart naming removes manual overhead, while clearer axis labeling and improved readability ensure that charts remain easy to interpret and share.
Dashboards are also more predictable and intentional: Charts now live on a fixed grid layout, preserving the structure originally designed regardless of screen size. Filters are easier to manage, too, with clear indicators and one-click reset options always visible when filters are applied.
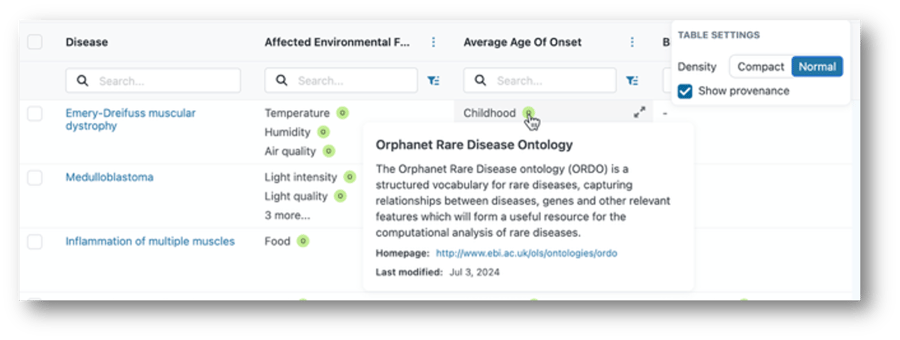
Confident decisions require clear understanding and context, not just results. DISQOVER now provides more transparency across tables, charts, and data models to ensure users always know what they’re looking at and where it comes from.
In tables, users can toggle on data provenance to see the source or sources behind every value. Charts now include richer contextual information, revealing property descriptions, contributing data sources, and indicators that explain sampling, excluded values, or multivalued properties. These cues help users interpret visualizations correctly and avoid misreading incomplete or nuanced data.
Additionally, the new data configuration view provides a centralized overview of the data model itself. Concepts, relationships, properties, data types, and provenance are all visible in one place, making it easier to understand, audit, and communicate the structure of the knowledge graph to colleagues and stakeholders.
DISQOVER doesn’t stop at discovery and data findability. Exporting data for downstream analysis is now more powerful and flexible thanks to the new bulk export to Parquet feature.
In addition to TTL, users can now export data in a format optimized for analytics pipelines:
Concretely, this means that users can export targeted subsets of their knowledge graph, like specific concepts or relationships, and bring only what’s relevant into downstream analytics environments. This makes it easy to extend DISQOVER insights into data science workflows, BI tools, or AI pipelines, without unnecessary data volume or loss of context.
These updates make DISQOVER faster to enter, easier to explore, clearer to understand, and more powerful to extend beyond the platform. Every improvement is designed to keep teams focused on exploring and understanding their data.
Want to see these features in action? One of our life sciences data experts would be happy to show you around the DISQOVER platform in a live demo for you and your team.
ONTOFORCE enables life science companies to unlock hidden insights from data.
With DISQOVER, built on knowledge graph technology, we support life sciences and pharmaceutical companies with innovative data management and visualization.
![]()
![]()
