

A knowledge graph represents a network of entities and visualizes the relationships between these entities to end users. The use of knowledge graphs has become increasingly popular in the biopharma industry, as the approach allows for large amounts of data from different sources to be integrated into one place.
ONTOFORCE’s life science knowledge discovery platform, DISQOVER, is underpinned by the knowledge graph concept. Combined with semantic search and an easy-to-use interface, DISQOVER enables organizations to create a customized, interoperable system that connects siloed internal data with third-party data so users can perform self-service data exploration, facilitating more efficient research.
In September of 2022, ONTOFORCE hosted a webinar centered on the use of knowledge graphs for drug discovery in biotechnology companies. On the topic, we had the pleasure of hearing from two individuals working in the biotech sphere: Paul Vauterin, CIO* of Aelin Therapeutics, and James Longden, Head of Discovery Biology at e-therapeutics PLC . The speakers not only elaborated on their organizational use of knowledge graphs to advance activities efficiently, but additionally they detailed how knowledge graphs enable their teams to uncover non-obvious relationships that would’ve otherwise remained hidden.
Below we are sharing some of the key insights from the webinar.
Aelin Therapeutics is an innovative Belgian biotech company focused on targeted protein aggregation. Their versatile in silico technology applies structural bioinformatics and machine learning to design sequence-specific, cell-permeable Pept-ins™ with vast potential to treat a range of disease indications.
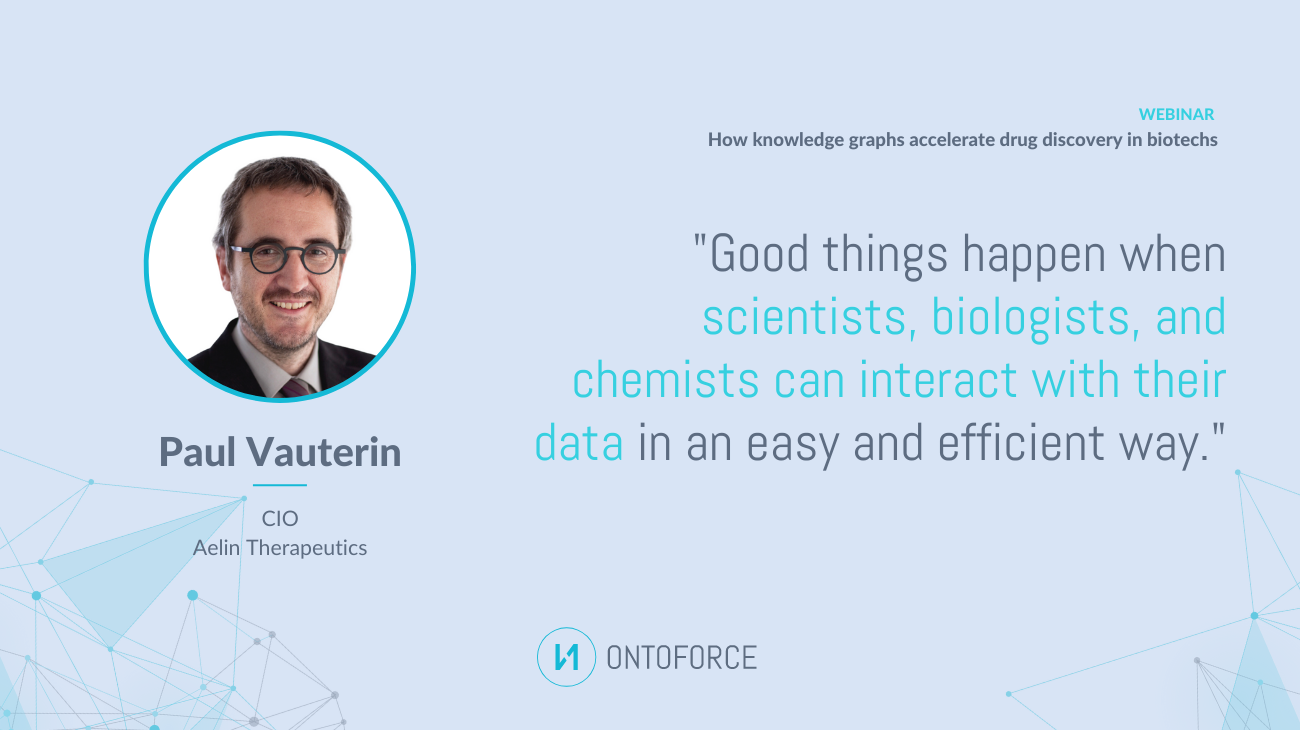
DISQOVER has been utilized at Aelin for several years now. For Aelin, DISQOVER is helping scientists firstly with the findability of information and secondly with descriptive analytics. Both are powered by self-service through a front-end interface where scientists can explore data and surf the knowledge graph easily, enabling them to efficiently interreact with their data in an intuitive way. In other words, DISQOVER allows data to talk to a user.
As Paul explained, when you have an activity that generates new data, this data needs to be linked, processed, annotated, and curated. It then gets integrated and consolidated into a knowledge graph where it becomes accessible for both human and machine processing. On the human end, for example, within DISQOVER, Aelin’s scientists are able to interact with the knowledge graph in a self-service way so they can easily locate the data they need, explore it, query it, export it and/or visualize it. This is where Aelin strongly relies on DISQOVER’s intuitive interface so they can ensure a good user experience for their colleagues.
The knowledge that is derived from using DISQOVER at Aelin ultimately helps to drive decision-making about which new activities to pursue. These new activities in turn create new data which is then fed into DISQOVER, resulting in a closed loop. This is how the Aelin’s discovery engine gets spinning and stays spinning, advancing their therapeutic programs.
In short, DISQOVER is making an impact at Aelin by:
e-Therapeutics is a pioneering network pharmacology company specialized on computational drug discovery with a focus on developing RNA interference therapeutics. Due to the complexity of their work, knowledge graphs are a necessity for their teams.
When building their knowledge graph in DISQOVER, e-Therapeutics brings together biological and chemistry informatics, natural language processing of the literature, OMICS based experiments, patents, and their own proprietary data. This creates an e-Therapeutics hepatocyte knowledge graph within DISQOVER.
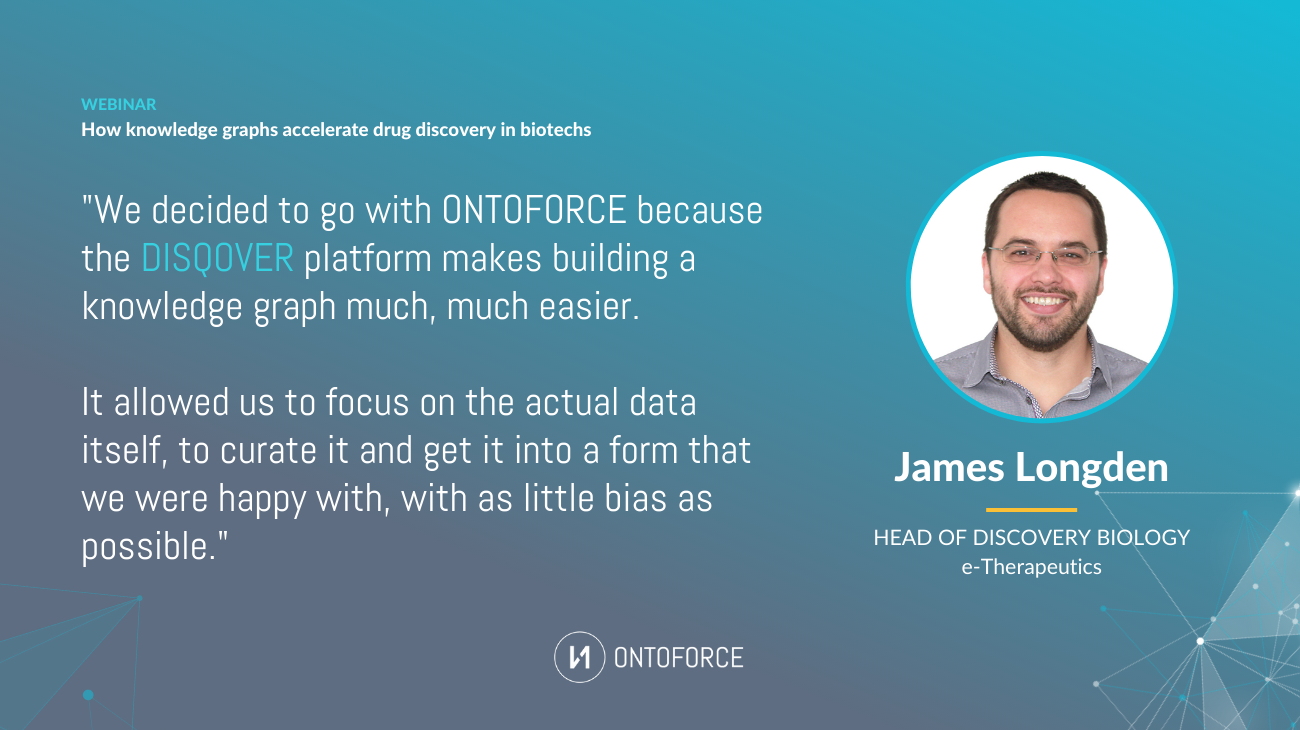
e-Therapeutics chose DISQOVER as their knowledge graph because of the platform’s efficiency. As James put it, there can never be enough data, however, as data is pulled from more and more sources to build the knowledge graph, different naming conventions are used across these sources to reference a single entity. One then needs to do manual mapping to standardize the ontologies. With DISQOVER, this process is streamlined, making building a knowledge graph a much easier task, leaving users the time to do what matter most: focus on the actual data itself.
For the type of target identification e-Therapeutics is doing, huge amounts of data are needed, however, it’s not always available. Knowledge graphs are a great way to get around this missing data problem, as they facilitate the visualization and discovery of non-obvious relationships between diseases, genes, and processes. Additionally, you can better tackle the sparse data problem by predicting edges in the knowledge graph using manual or automated walks, which then ultimately leads to making better predictions in your research.
The webinar concluded with a Q&A, with a particularly interesting question about fostering user adoption. Check out the webinar to hear not only James and Paul’s advice for encouraging user adoption, but also their word-for-word breakdown on the power of knowledge graphs to create efficiencies and accelerate timelines within the drug discovery cycle.
This blog post was adapted from a webinar wrap-up article.
* Paul Vauterin left Aelin Therapeutics in December of 2022
ONTOFORCE enables life science companies to unlock hidden insights from data.
With DISQOVER, built on knowledge graph technology, we support life sciences and pharmaceutical companies with innovative data management and visualization.
![]()
![]()
